
.avif)
If you open your sales dashboard right now, you will see motion. Calls made. Emails sent. Meetings booked. Activities logged. The numbers will be moving. The pipeline may not be.
That is the activity-output gap. And it is the reason most sales productivity metrics are measuring the wrong thing.
Activity metrics are speedometers. They tell you how fast the machine is running. They do not tell you whether the machine is pointed at the right destination, how much fuel it has, or whether the road it's on can take it where you need to go.
The metric that answers those questions is not on most CRO dashboards yet. It is Revenue Capacity per Rep, and it is the single most consequential metric shift a revenue leader can make in 2026.
Here is why the shift matters, how to measure it, and what to do with it.
Why Most Sales Productivity Metrics Are Broken
The problem is not that activity metrics are wrong. The problem is that they are incomplete in a specific and dangerous way.
Activity metrics assume a linear relationship between motion and outcome. If the rep makes more calls, they will book more meetings. If they send more emails, they will get more replies. If they attend more training sessions, they will close more deals. The underlying model is: more input equals more output.
That model was always fragile. In 2026, with AI changing what reps can do in a given hour, it has become actively misleading.
Consider two reps. Rep A makes 80 calls a week and closes two deals a quarter. Rep B makes 50 calls a week and closes four deals a quarter. On an activity dashboard, Rep A looks more productive. In reality, Rep B's capacity is double.
The difference is not effort. It is activation. Rep B is operating closer to their structural ceiling, spending less time on the work around the conversation and more time in the conversation itself. Rep A is working harder inside a lower ceiling.
Activity metrics cannot detect this difference. They see motion. They cannot see what that motion could structurally produce.
Activity metrics measure how fast the engine is running. Capacity metrics measure how much the engine can structurally produce. They are different instruments measuring different things. You need both, but most CROs only have one.
Activity, Output, and Capacity: A Three-Tier Distinction
Before defining Revenue Capacity per Rep, it helps to be clear about what it is not.
Activity: motion
Calls made. Emails sent. Meetings booked. Trainings completed. Content pieces shared. These are inputs. They measure what the rep did, not what that action produced. Activity metrics are useful for diagnosing process compliance and identifying reps who are not working. They are not useful for predicting revenue outcomes.
Output: what motion produced this period
Pipeline generated. Deals closed. Revenue landed. Quota attainment. These are results. They measure what happened. The problem with output metrics is that they are lagging indicators; by the time they show a problem, the problem has already cost you a quarter. Output tells you what the machine produced. It does not tell you whether the machine is capable of producing more.
Capacity: what motion could structurally produce
This is the metric most CROs are missing. Capacity is not what the rep produced. It is what they are structurally capable of producing, given their current activation level. Capacity is a ceiling. A rep at 60% of their capacity ceiling will produce the same output two quarters in a row, not because they are working harder or softer, but because nothing has changed about the structure of their activation.
The goal of Revenue Activation is to raise the ceiling. Not to make reps run faster at the same ceiling. That distinction is everything.
What Is Revenue Capacity per Rep?
The maximum revenue a single rep can structurally generate given their current activation level, measured across five levers: Ramp Acceleration, In-Flow Activation, Content Velocity, Coaching Precision, and Revenue Proof. Capacity is a ceiling, not a speedometer. Activity metrics tell you how fast the rep is moving. Capacity tells you how high the ceiling is.
Unit: Revenue per rep per quarter. Benchmark: what the top quartile rep produces when fully activated across all five levers.
Revenue Capacity per Rep is not a single data point. It is a composite measure derived from five activation levers, each of which represents a dimension along which a rep can either operate at ceiling or operate below it.
The five levers: Ramp Acceleration, In-Flow Activation, Content Velocity, Coaching Precision, and Revenue Proof, map to the five primary structural constraints on a rep's capacity to produce revenue. Every rep has a theoretical maximum. The gap between their current output and that maximum is the capacity gap. Closing the capacity gap is the job of Revenue Activation.
This matters for the metric conversation because it means Revenue Capacity per Rep is not a static number. It is a dynamic ceiling that moves as each lever is activated. A rep with low In-Flow Activation has a lower capacity ceiling than the same rep with high In-Flow Activation, even if their activity levels are identical.
How to Measure Revenue Capacity per Rep
Revenue Capacity per Rep is calculated by scoring each of the five levers on a 1-5 scale and weighting them against the rep's current quota. The formula:
Revenue Capacity per Rep = Quota × Weighted Activation Score (0.0 – 1.0)
The Weighted Activation Score is the average of the five lever scores, each normalised to a 0.0–1.0 range. A rep scoring 3/5 on all five levers has a Weighted Activation Score of 0.6, meaning they are operating at 60% of their structural capacity ceiling. Against a $500K annual quota, that rep is producing $300K when fully activated, they could produce $500K.
The gap, $200K per rep, is the Revenue Capacity gap. Multiply it across your team. That is the number your AI investment needs to close.
The five lever scores
Ramp Acceleration: Measures how quickly new reps reach full productivity. Score 1: reps take 9+ months to ramp. Score 5: reps reach full productivity in 60 days or less with AI-assisted onboarding.
In-Flow Activation: Measures whether reps receive the right intelligence at the right moment without having to search for it. Score 1: reps manually find content before calls. Score 5: context surfaces automatically in the rep's workflow based on deal signals.
Content Velocity: Measures the speed and accuracy with which the right content reaches the right deal moment. Score 1: reps use outdated decks from their desktop. Score 5: content is versioned, governed, and surfaced automatically.
Coaching Precision: Measures the quality and timeliness of coaching relative to actual deal behaviour. Score 1: coaching happens post-mortem, based on manager memory. Score 5: call signals are extracted automatically and coaching is delivered within 24 hours of the conversation.
Revenue Proof: Measures the ability to causally connect enablement activity to revenue outcomes. Score 1: enablement cannot prove its ROI. Score 5: every activation input is attributed to deal influence with CFO-ready reporting.
Run this scoring quarterly. The Weighted Activation Score should trend upward as each lever is activated. If it is not moving, neither is the capacity ceiling.
The Metrics That Feed Into Capacity
Revenue Capacity per Rep is a composite. The metrics that inform each lever score are the ones worth tracking at the operational level.
Pattern recognition: feeds Ramp Acceleration and In-Flow Activation
How quickly does the rep identify the right talk track, the right content, and the right stakeholder framing for a given deal context? Measured by: time to first qualified discovery question, content accuracy in first demo, competitive positioning accuracy. A rep with high pattern recognition operates faster and makes fewer positioning errors per deal.
Prep quality: feeds In-Flow Activation and Coaching Precision
What percentage of calls begin with the rep having reviewed the account context, the deal stage requirements, and the relevant content? Measured by: pre-call content access rate, CRM hygiene score at meeting creation, call plan completion rate. Prep quality is the leading indicator of conversation quality.
Conversation quality: feeds Coaching Precision and Revenue Proof
Does the rep's conversation behaviour match the methodology? Measured by: call scoring against defined criteria (MEDDPICC, Challenger, or equivalent), talk-to-listen ratio, question quality score. These are the lagging indicators of coaching effectiveness and the leading indicators of deal velocity.
Deal hygiene: feeds Revenue Proof
Is the CRM an accurate representation of the pipeline? Measured by: deal stage accuracy, next step completion rate, economic buyer identification rate. Deal hygiene is the foundation of Revenue Proof; without it, attribution is impossible.
Coaching adherence: feeds Coaching Precision and Ramp Acceleration
Are coaching interventions being applied in subsequent conversations? Measured by: behaviour change rate between coached calls, skill score trend over 90 days, certification-to-application gap. Coaching adherence is the metric that separates a coaching programme that changes behaviour from one that just documents it.
Why Capacity Is the Right Frame for the AI Era
Every AI investment in sales is structurally a capacity investment. Not a productivity investment. Not a time-saving investment. A ceiling-raising investment.
When AI handles the work around the conversation, the prep, the content retrieval, the CRM update, the follow-up draft, the call summary, it returns time to the rep. But more importantly, it raises the quality ceiling on every moment the rep spends in the conversation itself.
A rep who no longer spends 45 minutes prepping for a call does not close 45 extra minutes of deals. They close better deals because their prep was more precise, their content was more relevant, and their talk track was calibrated to the specific buyer context.
AI lifts the ceiling. Activity metrics cannot detect that lift. Revenue Capacity per Rep can.
The 16/16/27 framework makes this concrete. In a fully activated rep's workflow: 16 tasks are owned by AI (preparation, content surfacing, CRM hygiene, follow-up drafting), 16 tasks are owned by the human (relationship, judgment, negotiation, closing), and 27 tasks are collaborative (deal strategy, objection handling, champion activation). Activity metrics measure all 59 tasks as equivalent. Capacity metrics measure what the distribution of those 59 tasks enables the rep to produce.
This is why every AI investment should be evaluated against its impact on the Weighted Activation Score, not against time saved. Time saved is an activity metric. Ceiling raised is a capacity metric.
What a Capacity-First Dashboard Looks Like
The transition from activity-first to capacity-first does not require a complete dashboard rebuild. It requires replacing five specific charts with five better ones.
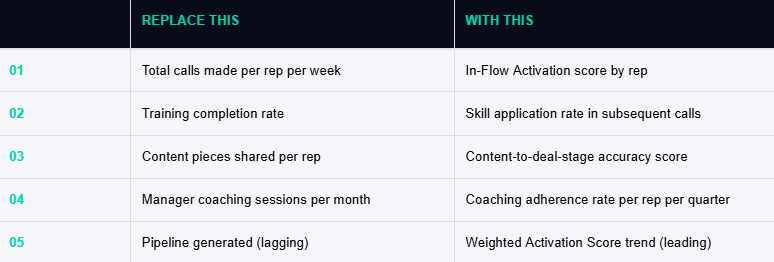
The before-and-after is significant. The activity dashboard shows what happened last week. The capacity dashboard shows what the team is structurally capable of producing next quarter. One is a rearview mirror. The other is a map.
For a CRO weekly review, the single most important number is the Weighted Activation Score trend, not per rep, but at the team level. If the score is rising, the ceiling is rising. If the score is flat, the AI investment is not changing what the team can structurally produce.
How to Transition from Activity-First to Capacity-First
The transition does not happen overnight. Attempting to replace activity metrics immediately creates resistance from sales managers who built their coaching practice around activity dashboards, and from reps who've been measured on activity for years.
The recommended approach is a two-quarter parallel run.
Quarter 1: introduce capacity metrics alongside activity
Run both dashboards simultaneously. Do not deprecate activity metrics yet. Use the quarter to calibrate the Weighted Activation Score against existing output data, validate that the score predicts quota attainment before you rely on it. Brief the management team on how to read capacity metrics and what interventions each lever score suggests.
Quarter 2: elevate capacity, deprioritise activity
Move capacity metrics to the primary dashboard position. Retain activity metrics as secondary diagnostics, useful for identifying specific process failures but not as the headline number. Begin running CRO reviews against the Weighted Activation Score trend. Set lever-specific targets for the next two quarters.
Quarter 3 onwards: capacity-first by default
Activity metrics become diagnostic tools, not performance measures. The primary question in every rep review is: which lever is constraining this rep's capacity ceiling, and what's the intervention? The conversation shifts from 'why are your calls down' to 'your Coaching Precision score is 2.8, here's what changes.'
Frequently Asked Questions
What's wrong with measuring sales activity?
Activity metrics measure motion, not capacity. They tell you how many calls a rep made, not whether those calls were effective, well-prepared, or targeted at the right buyers. The core problem is that two reps with identical activity levels can have dramatically different revenue output, and activity metrics cannot explain why. Revenue Capacity per Rep explains why.
What's the difference between sales productivity and sales output?
Output is what the rep produced in a given period, pipeline, deals closed, revenue landed. Productivity, properly understood, is the relationship between input and output: how much output a rep generates per unit of input. The problem with most 'productivity' metrics is that they conflate activity (input) with output, when what matters is the structural ceiling on what any given input level can produce. That ceiling is capacity.
What is Revenue Capacity per Rep?
Revenue Capacity per Rep is the maximum revenue a single rep can structurally generate given their current activation level across the Five Levers of Revenue Activation: Ramp Acceleration, In-Flow Activation, Content Velocity, Coaching Precision, and Revenue Proof. It is calculated as a function of quota and the rep's Weighted Activation Score, a composite of their lever scores normalised to a 0.0–1.0 range. A rep at 0.6 is operating at 60% of their structural capacity ceiling.
Can you measure Revenue Capacity per Rep without AI?
Yes, but the measurement is labour-intensive and the levers are harder to move. You can score Ramp Acceleration manually through onboarding surveys and ramp-time tracking. You can score Content Velocity through content audit and usage data. You can score Coaching Precision through call review programmes. What AI changes is not the measurability of capacity but the speed at which the levers can be activated, and the granularity of the data that informs each score.
Which activity metrics should a CRO drop first?
Start with the metrics that measure motion without any connection to outcome quality: total calls per week, total emails per week, and training completion rate as a standalone number. These tell you the rep is moving without telling you whether the movement is productive. Replace them with: In-Flow Activation score, coaching adherence rate, and Weighted Activation Score trend. Keep pipeline and quota attainment as output benchmarks; they are lagging but necessary. The goal is not to eliminate output metrics but to add the leading capacity metrics that predict them.
Revenue Capacity per Rep is not a metric for analysts. It is the operating metric for a CRO who wants to know whether their team is reaching its structural ceiling, and where to intervene when it isn't.
If you want to score your team's current activation level across the Five Levers, the Revenue Activation Assessment at revenueactivators.ai takes eight minutes and shows you exactly where the capacity gap is largest.